Canonical Correlation Analysis (CCA)

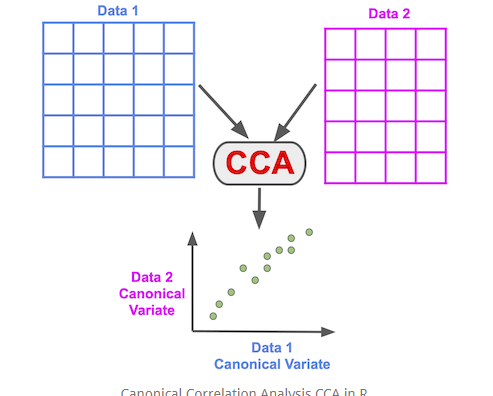
Canonical Correlation Analysis (CCA) is a statistical method used to analyze the relationship between two sets of variables. It is a multivariate technique that seeks to find the linear combination of variables in each set that has the highest correlation with the linear combination of variables in the other set.

In other words, CCA aims to find the linear combinations of variables in two sets that are most related to each other, while also maximizing the correlation within each set. It is a useful tool in data analysis when there are two or more sets of variables that are thought to be related.

The basic steps of CCA are as follows:

  1. Standardize the data in each set so that they have a mean of 0 and a standard deviation of 1.

  2. Calculate the cross-covariance matrix between the two sets of variables.

  3. Calculate the eigenvalues and eigenvectors of the cross-covariance matrix.

  4. Determine the canonical correlations and the corresponding canonical variables.

  5. Interpret the canonical correlations and variables to understand the relationship between the two sets of variables.

The output of CCA includes the canonical correlations, which indicate the strength of the relationship between the canonical variables, and the canonical loadings, which indicate the contribution of each variable to each canonical variable.

CCA has applications in many fields, including economics, psychology, biology, and engineering. It can be used for data reduction, to identify underlying factors or dimensions, and to predict outcomes based on multiple sets of variables.

Canonical Correlation Analysis (CCA) with R

““CCA” package Provides a set of functions that extend the ‘cancor’ function with new numerical and graphical outputs. It also include a regularized extension of the canonical correlation analysis to deal with datasets with more variables than observations.

install.packages(“CCA”)

Code
library(tidyverse)
── Attaching core tidyverse packages ──────────────────────── tidyverse 2.0.0 ──
✔ dplyr     1.1.2     ✔ readr     2.1.4
✔ forcats   1.0.0     ✔ stringr   1.5.0
✔ ggplot2   3.4.2     ✔ tibble    3.2.1
✔ lubridate 1.9.2     ✔ tidyr     1.3.0
✔ purrr     1.0.1     
── Conflicts ────────────────────────────────────────── tidyverse_conflicts() ──
✖ dplyr::filter() masks stats::filter()
✖ dplyr::lag()    masks stats::lag()
ℹ Use the conflicted package (<http://conflicted.r-lib.org/>) to force all conflicts to become errors

Data

In this exercise we will use following data set.

gp_soil_data.csv

Code
library(tidyverse)
# define file from my github
urlfile = "https://github.com//zia207/r-colab/raw/main/Data/USA/gp_soil_data.csv"
mf<-read_csv(url(urlfile))

Preparing Two Datasets for Canonical Correlation Analysis (CCA)

We will split the penguin’s body measurements into two high-dimensional datasets and We will also scale the variables to put them on the same scale.

  1. X: Data with train variables: DEM, Aspect, Slope, and TP1

  2. Y: MAT, MAP, NDVI

Code
# Create  data-frames
X<-mf %>% dplyr::select( DEM, Aspect, Slope,TPI) %>%
  scale()

Y<-mf %>% dplyr::select(MAT, MAP, NDVI) %>%
  scale()

Compute canonical correlations

The cancor() function of CCA package is used for computing canonical correlations between two sets of variables.

Code
cc <- cancor(X,Y)

cancor() function returns a list containing the correlation between the variables and the coefficients

Code
str(cc)
List of 5
 $ cor    : num [1:3] 0.857 0.553 0.183
 $ xcoef  : num [1:4, 1:4] 0.05263 -0.00251 -0.00916 -0.00308 0.03601 ...
  ..- attr(*, "dimnames")=List of 2
  .. ..$ : chr [1:4] "DEM" "Aspect" "Slope" "TPI"
  .. ..$ : NULL
 $ ycoef  : num [1:3, 1:3] -0.04243 -0.01461 -0.00525 0.01922 -0.03444 ...
  ..- attr(*, "dimnames")=List of 2
  .. ..$ : chr [1:3] "MAT" "MAP" "NDVI"
  .. ..$ : NULL
 $ xcenter: Named num [1:4] 5.06e-17 2.66e-16 1.00e-17 -6.50e-18
  ..- attr(*, "names")= chr [1:4] "DEM" "Aspect" "Slope" "TPI"
 $ ycenter: Named num [1:3] -2.10e-16 5.66e-17 1.46e-16
  ..- attr(*, "names")= chr [1:3] "MAT" "MAP" "NDVI"
Code
print(cc)
$cor
[1] 0.8573999 0.5530778 0.1828072

$xcoef
               [,1]         [,2]        [,3]         [,4]
DEM     0.052632132  0.036014771  0.01251337 -0.005520457
Aspect -0.002505462 -0.008496253  0.03772102  0.028805905
Slope  -0.009159251 -0.059569664 -0.02733187 -0.002101725
TPI    -0.003082211 -0.010559004  0.02497863 -0.037444837

$ycoef
             [,1]         [,2]        [,3]
MAT  -0.042429859  0.019223196 -0.02211589
MAP  -0.014608094 -0.034441590  0.07607734
NDVI -0.005251573 -0.009221375 -0.08590261

$xcenter
          DEM        Aspect         Slope           TPI 
 5.057815e-17  2.663915e-16  1.001459e-17 -6.504284e-18 

$ycenter
          MAT           MAP          NDVI 
-2.102767e-16  5.658096e-17  1.456276e-16 

Interpretation the results of a CCA

In order to interpret the results of a CCA, it is important to look at both the canonical correlations and the canonical variables. The canonical correlations indicate how strongly the two sets of variables are related, while the canonical variables show which variables in each set are most strongly related to each other.

Correlations between the canonical variates

Code
cc$cor
[1] 0.8573999 0.5530778 0.1828072

The correlation between the first canonical variates from these two data is pretty high, suggesting that both the data sets have strong covariation.

Get the Canonical covariate Pairs

Code
CC1_X <- as.matrix(X) %*% cc$xcoef[, 1]
CC1_Y <- as.matrix(Y) %*% cc$ycoef[, 1]
Code
CC2_X <- as.matrix(X) %*% cc$xcoef[, 2]
CC2_Y <- as.matrix(Y) %*% cc$ycoef[, 2]

Create a dataframe canonical covariates

Code
cca_df <- mf %>% 
  mutate(CC1_X=CC1_X,
         CC1_Y=CC1_Y,
         CC2_X=CC2_X,
         CC2_Y=CC2_Y) %>%
  glimpse()
Rows: 467
Columns: 23
$ ID        <dbl> 1, 2, 3, 4, 5, 6, 7, 8, 9, 10, 11, 12, 13, 14, 15, 16, 17, 1…
$ FIPS      <dbl> 56041, 56023, 56039, 56039, 56029, 56039, 56039, 56039, 5603…
$ STATE_ID  <dbl> 56, 56, 56, 56, 56, 56, 56, 56, 56, 56, 56, 56, 56, 56, 56, …
$ STATE     <chr> "Wyoming", "Wyoming", "Wyoming", "Wyoming", "Wyoming", "Wyom…
$ COUNTY    <chr> "Uinta County", "Lincoln County", "Teton County", "Teton Cou…
$ Longitude <dbl> -111.0119, -110.9830, -110.8065, -110.7344, -110.7308, -110.…
$ Latitude  <dbl> 41.05630, 42.88350, 44.53497, 44.43289, 44.80635, 44.09124, …
$ SOC       <dbl> 15.763, 15.883, 18.142, 10.745, 10.479, 16.987, 24.954, 6.28…
$ DEM       <dbl> 2229.079, 1889.400, 2423.048, 2484.283, 2396.195, 2360.573, …
$ Aspect    <dbl> 159.1877, 156.8786, 168.6124, 198.3536, 201.3215, 208.9732, …
$ Slope     <dbl> 5.6716146, 8.9138117, 4.7748051, 7.1218114, 7.9498644, 9.663…
$ TPI       <dbl> -0.08572358, 4.55913162, 2.60588670, 5.14693117, 3.75570583,…
$ KFactor   <dbl> 0.31999999, 0.26121211, 0.21619999, 0.18166667, 0.12551020, …
$ MAP       <dbl> 468.3245, 536.3522, 859.5509, 869.4724, 802.9743, 1121.2744,…
$ MAT       <dbl> 4.5951686, 3.8599243, 0.8855000, 0.4707811, 0.7588266, 1.358…
$ NDVI      <dbl> 0.4139390, 0.6939532, 0.5466033, 0.6191013, 0.5844722, 0.602…
$ SiltClay  <dbl> 64.84270, 72.00455, 57.18700, 54.99166, 51.22857, 45.02000, …
$ NLCD      <chr> "Shrubland", "Shrubland", "Forest", "Forest", "Forest", "For…
$ FRG       <chr> "Fire Regime Group IV", "Fire Regime Group IV", "Fire Regime…
$ CC1_X     <dbl[,1]> <matrix[26 x 1]>
$ CC1_Y     <dbl[,1]> <matrix[26 x 1]>
$ CC2_X     <dbl[,1]> <matrix[26 x 1]>
$ CC2_Y     <dbl[,1]> <matrix[26 x 1]>
Scatter plot between the first pair of canonical covariate

Code
#| fig.width: 5.5
#| fig.height: 4
cca_df %>% 
  ggplot(aes(x=CC1_X,y=CC1_Y, color=NLCD))+
  geom_point()

To see if each of canonical variate is correlated with NLCD, you create boxplots between two canonical covariates and NLCD.

Code
#| fig.width: 8
#| fig.height: 5

# First Canonical Variate of X vs Latent Variable
p1<-cca_df %>% 
  ggplot(aes(x=NLCD,y=CC1_X, color=NLCD))+
  geom_boxplot(width=0.5)+
  geom_jitter(width=0.15)+
  theme(legend.position="none")+
  ggtitle("First Canonical Variate of X vs NLCD") 

# First Canonical Variate of Y vs Latent Variable
p2<-cca_df %>% 
  ggplot(aes(x=NLCD,y=CC1_Y, color=NLCD))+
  geom_boxplot(width=0.5)+
  geom_jitter(width=0.15)+
  theme(legend.position="none")+
  ggtitle("First Canonical Variate of Y vs NLCD") 
Code
library(patchwork)
p1+p2

Further Reading

  1. Introduction to Canonical Correlation Analysis (CCA) in R

  2. CANONICAL CORRELATION ANALYSIS | R DATA ANALYSIS EXAMPLES