Principal Component Analysis (PCA)

Principal Component Analysis OR PCA is a statistical technique that is commonly used for data analysis and dimensionality reduction. The main goal of PCP analysis is to identify the underlying patterns or structure in a dataset by transforming the original variables into a smaller number of uncorrelated variables, called principal components.

Imagine you have a large dataset with many variables and you want to simplify it into a smaller set of variables that still capture the most important information. PCA helps you do that by identifying patterns and relationships among the original variables, and then creating a new set of variables that summarize those patterns.

Once the principal components are identified, they can be used as new variables that represent the original dataset. These new variables will be fewer in number, but they will contain most of the original information. This can be useful for tasks such as data visualization, data compression, or feature selection for machine learning models.

In summary, PCA is a technique that helps simplify a large dataset into a smaller set of variables that still capture most of the important information. It does this by identifying the most important patterns and relationships in the data and summarizing them into a new set of variables called the principal components.

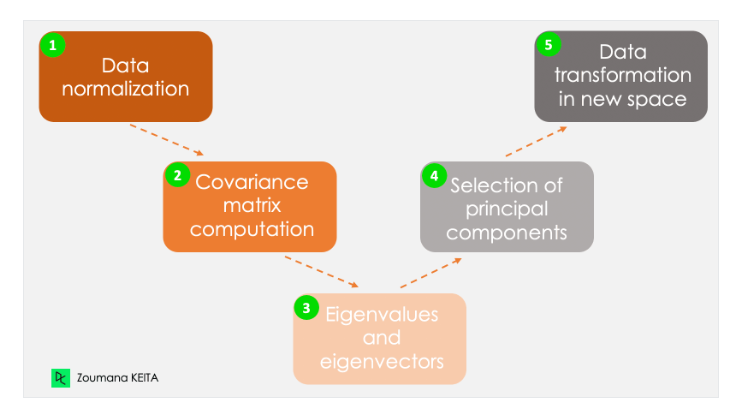
The mathematical concept of PCA is somewhat complex. However, understanding the following five steps can give a better idea of how to compute the PCA.

Here’s a step-by-step overview of how PCA works:

  1. Standardize the data: First, we need to standardize the data so that all variables have the same scale. This is important because PCA is sensitive to differences in scale between variables.

  2. Calculate the covariance matrix: Next, we calculate the covariance matrix of the standardized data. The covariance matrix shows how the variables are related to each other.

  3. Calculate the eigenvectors and eigenvalues of the covariance matrix: The eigenvectors and eigenvalues of the covariance matrix tell us how much each principal component (PC) explains the variation in the data. The eigenvectors are the directions of the new variables (PCs) and the eigenvalues are the amount of variance explained by each PC.

  4. Choose the number of PCs to retain: We can use the eigenvalues to decide how many PCs to retain. A common rule of thumb is to retain enough PCs to explain at least 70-80% of the variation in the data.

  5. Transform the data: Once we’ve decided how many PCs to retain, we can transform the data into the new PC space. Each observation in the original data is now represented by a set of values for each PC.

  6. Interpret the PCs: Finally, we can interpret the PCs to understand how they relate to the original variables. The first PC explains the most variation in the data, and subsequent PCs explain less and less variation. We can look at the loadings (i.e., the correlation between each original variable and each PC) to see which variables contribute most to each PC.

Note

Covariance matrix:

In statistics, a covariance matrix is a square matrix that summarizes the covariance between multiple variables. It is a mathematical representation of how much two or more variables vary together.

The covariance between two variables is a measure of how much they change together. If the two variables increase or decrease together, then they have a positive covariance. If one variable increases while the other decreases, then they have a negative covariance. If there is no relationship between the variables, then their covariance is zero.

A covariance matrix shows the covariance between every pair of variables in a dataset. It is a square matrix where each row and column represents a different variable, and the entries in the matrix are the covariances between the corresponding pairs of variables. The diagonal entries of the matrix are the variances of each variable, since the covariance between a variable and itself is its own variance.

Covariance matrices are often used in multivariate statistical analysis, such as principal component analysis (PCA) and linear discriminant analysis (LDA), to identify patterns and relationships between variables. They can also be used to calculate the correlation matrix, which is a standardized version of the covariance matrix that measures the strength of linear relationships between variables.

Eigenvectors and eigenvalues:

Eigenvectors and eigenvalues are important concepts in linear algebra. In simple terms, an eigenvector is a vector that, when multiplied by a matrix, yields a scalar multiple of itself. The scalar multiple is called the eigenvalue.

More specifically, let’s say we have a square matrix A, and we want to find its eigenvectors and eigenvalues. An eigenvector x of A is a non-zero vector that satisfies the following equation:

Ax = λx

where λ is a scalar, which is called the eigenvalue. In other words, when we multiply the matrix A by the eigenvector x, we get a scaled version of x, where the scaling factor is the eigenvalue λ.

Data

In this exercise we will use following data set PCA analysis. This dataset contains mean MODIS NDVI for the boro season, 2014-2015 .

bd_boro_NDVI.csv

Code
library(tidyverse)
urlfile = "https://github.com//zia207/r-colab/raw/main/Data/Bangladesh/bd_boro_NDVI.csv"
mf<-read_csv(url(urlfile))%>%
    glimpse()
Rows: 223
Columns: 21
$ UNION_ID      <dbl> 10040907, 10061031, 10063613, 10065177, 10069494, 100918…
$ x             <dbl> 519852.2, 513008.6, 556755.4, 541836.9, 516049.7, 568765…
$ y             <dbl> 2439890, 2524428, 2538580, 2508902, 2527786, 2511181, 24…
$ LONG          <dbl> 90.1924, 90.1268, 90.5536, 90.4073, 90.1564, 90.6696, 90…
$ LAT           <dbl> 22.0637, 22.8275, 22.9544, 22.6868, 22.8578, 22.7065, 22…
$ DIVISION      <chr> "Barisal", "Barisal", "Barisal", "Barisal", "Barisal", "…
$ DISTRICT      <chr> "Barguna", "Barisal", "Barisal", "Barisal", "Barisal", "…
$ UPAZILA       <chr> "Amtali", "Banaripara", "Hizla", "Barisal", "Wazirpur", …
$ UNION         <chr> "Amtali", "Bisarkandi", "Bara Jalia", "Roy Pasha Karapur…
$ NDVI_305_2014 <dbl> 0.769, 0.693, 0.675, 0.782, 0.727, 0.593, 0.772, 0.765, …
$ NDVI_321_2014 <dbl> 0.601, 0.572, 0.552, 0.653, 0.587, 0.478, 0.569, 0.590, …
$ NDVI_337_2014 <dbl> 0.549, 0.553, 0.520, 0.673, 0.557, 0.446, 0.543, 0.518, …
$ NDVI_353_2014 <dbl> 0.448, 0.612, 0.518, 0.639, 0.563, 0.405, 0.492, 0.396, …
$ NDVI_001_2105 <dbl> 0.426, 0.615, 0.542, 0.605, 0.554, 0.418, 0.485, 0.364, …
$ NDVI_017_2015 <dbl> 0.414, 0.606, 0.506, 0.579, 0.536, 0.423, 0.494, 0.345, …
$ NDVI_033_2015 <dbl> 0.409, 0.608, 0.508, 0.561, 0.560, 0.452, 0.508, 0.326, …
$ NDVI_049_2015 <dbl> 0.418, 0.640, 0.539, 0.632, 0.660, 0.496, 0.508, 0.415, …
$ NDVI_065_2015 <dbl> 0.424, 0.690, 0.570, 0.671, 0.708, 0.528, 0.497, 0.481, …
$ NDVI_081_2015 <dbl> 0.469, 0.696, 0.563, 0.724, 0.741, 0.518, 0.509, 0.582, …
$ NDVI_097_2015 <dbl> 0.504, 0.677, 0.603, 0.726, 0.714, 0.532, 0.555, 0.648, …
$ NDVI_113_2015 <dbl> 0.504, 0.677, 0.603, 0.726, 0.714, 0.532, 0.555, 0.648, …
Principal Component Analysis with prcomp()

Data normalization

PCA analysis with data with different scales or units may lead to a biased result. Data normalization is a technique used in data analysis to transform data into a common scale or format, which allows for easier comparison and analysis. It ensures that each attribute has the same level of contribution, preventing one variable from dominating others.

There are different methods of data normalization, but the most commonly used ones are:

Min-max normalization: This method rescales the data to a fixed range, typically between 0 and 1. It involves subtracting the minimum value of the variable from each observation and then dividing by the range (i.e., the difference between the maximum and minimum values).

Z-score normalization: This method standardizes the data by subtracting the mean from each observation and dividing by the standard deviation. This results in a new distribution with a mean of 0 and a standard deviation of 1.

Decimal scaling normalization: This method involves moving the decimal point of the values to the left or right, so that the largest absolute value is less than 1. For example, if the largest value is 500, we can divide all values by 1000, so that the largest value becomes 0.5.

First we will create a subset of the numeric variables from the dataset:

Code
df<- mf[,10:21]

In R, scale() is generic function whose default method centers and/or scales the columns of a numeric matrix.

Code
df_scale <- scale(df) 
head(df_scale)
     NDVI_305_2014 NDVI_321_2014 NDVI_337_2014 NDVI_353_2014 NDVI_001_2105
[1,]    1.21456759    1.03544930     0.8822451    -0.1221384    -0.3213460
[2,]    0.68217333    0.79760563     0.9195826     1.4783076     1.5883790
[3,]    0.55607996    0.63357552     0.6115482     0.5609788     0.8507604
[4,]    1.30563503    1.46192761     2.0397078     1.7417957     1.4873354
[5,]    0.92034971    0.92062822     0.9569201     1.0001256     0.9720127
[6,]   -0.01834542    0.02666409    -0.0791957    -0.5417675    -0.4021809
     NDVI_017_2015 NDVI_033_2015 NDVI_049_2015 NDVI_065_2015 NDVI_081_2015
[1,]    -0.3586689   -0.48962559   -1.03929304    -1.3803747    -0.9221907
[2,]     1.4606376    1.44227757    0.96324622     0.8117134     0.8567893
[3,]     0.5130822    0.47147196    0.05218106    -0.1771985    -0.1855205
[4,]     1.2047976    0.98599894    0.89108264     0.6551356     1.0762230
[5,]     0.7973488    0.97629088    1.14365516     0.9600501     1.2094506
[6,]    -0.2733889   -0.07217918   -0.33569816    -0.5233177    -0.5381818
     NDVI_097_2015 NDVI_113_2015
[1,]    -0.8192240    -0.8192240
[2,]     0.6215511     0.6215511
[3,]     0.0052658     0.0052658
[4,]     1.0296319     1.0296319
[5,]     0.9296937     0.9296937
[6,]    -0.5860349    -0.5860349

We cam compute the correlation matrix cor() function from the corrr package and ggcorrplot() can be applied then for better visualization

install.packages(“corrr”)

install.packages(“ggcorrplot”)

Code
#| fig.width: 10
#| fig.height: 8

library(corrr)
library(ggcorrplot)

corr_matrix <- cor(df_scale)
ggcorrplot(corr_matrix)

The result of the correlation matrix can be interpreted as follow:

  • The higher the value, the most positively correlated the two variables are.

  • The closer the value to -1, the most negatively correlated they are.

In R, PCA can be performed using the **princomp()* function in the base stats package.

Applying PCA

Next, we will use the prcomp() function to produces an unrotated principal component analysis. In traditional PCA, the data is rotated to obtain these principal components. However, in unrotated PCA, the principal components are obtained without any rotation of the original data. This means that the resulting principal components are simply linear combinations of the original variables, without any adjustment for correlation or dependence between variables.

Unrotated PCA is sometimes used in situations where the goal is to obtain a simple summary of the data rather than to identify underlying factors or dimensions. It can also be used as a preliminary step before applying more complex methods of factor analysis or structural equation modeling. However, it is important to note that unrotated PCA can sometimes yield results that are difficult to interpret or that do not capture the underlying structure of the data as well as rotated PCA.

We will not use transformed data that have done before. Rather, we will set the center and scale parameters to TRUE to center and scale the data. CORR is a logical value indicating whether the calculation should use the correlation matrix or the covariance matrix. (The correlation matrix can only be used if there are no constant variables.

Code
# Perform PCA on the numeric variables
pca <- princomp(mf[, -c(1:11)], center = TRUE, scale = TRUE, cor = TRUE )
Code
# Print the summary of the PCA object
summary(pca)
Importance of components:
                          Comp.1    Comp.2    Comp.3     Comp.4     Comp.5
Standard deviation     2.2184639 1.8114969 1.0533509 0.53745744 0.43422551
Proportion of Variance 0.4921582 0.3281521 0.1109548 0.02888605 0.01885518
Cumulative Proportion  0.4921582 0.8203103 0.9312651 0.96015118 0.97900636
                           Comp.6      Comp.7     Comp.8      Comp.9
Standard deviation     0.31756834 0.228434736 0.19006263 0.144154561
Proportion of Variance 0.01008497 0.005218243 0.00361238 0.002078054
Cumulative Proportion  0.98909132 0.994309566 0.99792195 1.000000000
                            Comp.10
Standard deviation     1.862645e-09
Proportion of Variance 3.469447e-19
Cumulative Proportion  1.000000e+00

Based on the summary we can see that total 12 principal components have been generated (Comp.1 to Comp.12), which also correspond to the number of variables in the data.Each component explains a percentage of the total variance in the data set. In the Cumulative Proportion section, the first principal component explains almost only 47% of the total variance. The cumulative proportion from Comp.1 to Comp.4 explains nearly 94% of the total variance. This means that the these 4 components can accurately represent the data.

Loading

The loading of each PC represents the contribution of each original variable to that PC. In other words, the loading of a PC tells you how much each original variable “weighs” in that PC. The higher the loading of a variable on a PC, the more important that variable is in explaining the variation in that PC. Loadings are typically expressed as coefficients or weights, and they can be positive or negative.

Overall, the loading of PCA is an important concept because it helps us to understand which variables are most important in explaining the variation in the data, and how the PCs are constructed from the original variables.

Code
pca$loadings[, 1:4]
                 Comp.1     Comp.2      Comp.3      Comp.4
NDVI_337_2014 0.2882126  0.2353856  0.53519081  0.38008392
NDVI_353_2014 0.3161446  0.3261931  0.31331450  0.22942899
NDVI_001_2105 0.3024536  0.3820128  0.05382333 -0.20391208
NDVI_017_2015 0.2828175  0.3919027 -0.23927853 -0.22396535
NDVI_033_2015 0.2880179  0.3002068 -0.42525940 -0.32575710
NDVI_049_2015 0.3166130 -0.1099282 -0.52997729  0.69488491
NDVI_065_2015 0.3382228 -0.3210925 -0.14710472 -0.03331547
NDVI_081_2015 0.3383687 -0.3457584  0.02735286 -0.01171921
NDVI_097_2015 0.3416402 -0.3269652  0.18860566 -0.24589422
NDVI_113_2015 0.3416402 -0.3269652  0.18860566 -0.24589422

The loading matrix shows that the first principal component has high positive values for all metals.

Visualization of the principal components

Scree Plot

A Scree Plot is a graphical representation of the eigenvalues associated with each principal component in a PCA. It is named after the “scree” of a hill, which is a steep slope that separates two different areas. In a Scree Plot, the x-axis represents the principal components, while the y-axis represents the eigenvalues. The eigenvalue of a principal component reflects the amount of variance in the data that is explained by that particular component. The Scree Plot displays the eigenvalues in descending order, with the largest eigenvalue on the left and the smallest on the right. The Scree Plot is a useful tool for determining the optimal number of principal components to retain in a PCA analysis. Typically, the goal is to retain enough principal components to explain a high percentage of the variance in the data while minimizing the number of components retained.

screeplot() function plots the variances against the number of the principal component.

Code
#| fig.width: 5
#| fig.height: 5
screeplot(pca, type = "l", npcs = 12, main = "Screeplot of  PCs")
abline(h = 1, col="red", lty=5)
legend("topright", legend=c("Eigenvalue = 1"),
       col=c("red"), lty=5, cex=0.6)

The screen plot shows the eigenvalues in a downward curve, from highest to lowest. The first 3 components can be considered to be the most significant since they contain almost 90% of the total information of the data and Eigenvalues greater than 1.

Note

Eigenvalues measures how each variable is associated with one another using a Covariance matrix

You can extract scores and save them for further analysis

Code
scores.ndvi<-as.data.frame(pca$scores[,1:3])
names(scores.ndvi)[1] <- "PC1_ndvi"
names(scores.ndvi)[2] <- "PC2_ndvi"
names(scores.ndvi)[3] <- "PC3_ndvi"
scores.ndvi<-cbind(ID=mf$UNION_ID,scores.ndvi)
write_csv(scores.ndvi, "pc_scores_modis_ndvi.csv")

Biplot of the attributes

A biplot is a graphical representation of multivariate data that displays both the observations and the variables on the same plot. It can be used to visualize the relationships between the observations and the variables and to identify patterns and structures in the data.

we will use fviz_pca_biplot() function from factoextra package

install.packages(“factoextra”)

Code
#| fig.width: 5
#| fig.height: 5
library(factoextra)
fviz_pca_biplot(pca, label = "var", axes = 1:2, addEllipses=TRUE, llipse.level=0.95)

Contribution of each variable on the most important components

The goal of the third visualization is to determine how much each variable is represented in a given component. Such a quality of representation is called the Cos2 and corresponds to the square cosine, and it is computed using the fviz_cos2()of factoextra package. This function can be used to visualize the quality of representation (cos2) of rows/columns from the results of Principal Component Analysis (PCA).

Code
#| fig.width: 5
#| fig.height: 5
library(factoextra)

# Contributions of variables to PC1
fviz_contrib(pca, choice = "var", axes = 1, top = 10)

Code
# Contributions of variables to PC2
fviz_contrib(pca, choice = "var", axes = 2, top = 10)

A low value means that the variable is not perfectly represented by that component. A high value, on the other hand, means a good representation of the variable on that component.

We can also plot the results of the PCA using the biplot function, which shows both the loadings of each variable on the principal components and the scores of each observation on the principal components. We will use fviz_pca_var() of factoextra package.

Code
#| fig.width: 6
#| fig.height: 5
fviz_pca_var(pca, col.var = "cos2",
            gradient.cols = c("black", "orange", "green"),
            repel = TRUE)

Note that there are many additional options that can be specified in the prcomp function, such as the number of principal components to extract, the method for calculating the covariance matrix, and more. For more information, see the help documentation for the prcomp function in R.

Exercise

  1. Create a R-Markdown documents (name homework_09.rmd) in this project and do all Tasks using the data shown below.

  2. Submit all codes and output as a HTML document (homework_09.html) before class of next week.

Required R-Package

tidyverse, factoextra

Data

  1. bd_boro_TEMP.csv

Download the data and save in your project directory. Use read_csv to load the data in your R-session. For example:

df<-read_csv(“bd_boro_TEMP.csv”)

Tasks

  1. Using t2m (air temperature) values, do PCA analysis and report summary of PCA

  2. Find loading of first four components

  3. Create a screen plots the eigenvalues associated (percent variation) with each principal component in a PCA

  4. Draw a bi-plots of PC1 and PC2

  5. Visualize the contribution of each variable on the most important components (PC1 and PC2)

Further Reading

  1. Principal Component Analysis in R Tutorial

  2. Principal Components Analysis in R: Step-by-Step Example

YouTube Vedio

  1. StatQuest: PCA main ideas in only 5 minutes!!!

Source: StatQuest with Josh Starme