Code
library(tidyverse)
library(tidymodels)
library(Metrics)
H2O’s Stacked Ensemble method is a supervised ensemble machine learning algorithm that finds the optimal combination of a collection of prediction algorithms using a process called stacking. Like all supervised models in H2O, Stacked Ensemeble supports regression, binary classification, and multiclass classification.
To create stacked ensembles with H2O in R, you can follow these general steps:
Set up the Ensemble: Specify a list of L base algorithms (with a specific set of model parameters) and specify a metalearning algorithm
Grid Search: Find the best base model for each L-base algorithms using hyperprameter grid search
Train L-base models : Perform k-fold cross-validation on each of these learners and collect the cross-validated predicted values from each of the L algorithms.
Prediction: The N cross-validated predicted values from each of the L algorithms can be combined to form a new N x L matrix. This matrix, along with the original response vector, is called the “level-one” data. (N = number of rows in the training set.
Train with the Metalearner: Train the metalearning algorithm on the level-one data. The “ensemble model” consists of the L base learning models and the metalearning model, which can then be used to generate predictions on a test set.
Predict with the stacked ensemble: Once the stack ensemble is trained, you can use it to make predictions on new, unseen data.
Shutdown the H2O cluster: After you have finished using H2O, it’s good practice to shut down the H2O cluster by running h2o.shutdown().
library(tidyverse)
library(tidymodels)
library(Metrics)In this exercise we will use following synthetic data set and use DEM, Slope, TPI, MAT, MAP, NDVI, NLCD, and FRG to fit Deep Neural Network regression model. This data was created with AI using gp_soil_data data set.
# define file from my github
urlfile = "https://github.com//zia207/r-colab/raw/main/Data/USA/gp_soil_data_syn.csv"
mf<-read_csv(url(urlfile))
# Create a data-frame
df<-mf %>% dplyr::select(SOC, DEM, Slope, TPI,MAT, MAP,NDVI, NLCD, FRG)%>%
    glimpse()
Rows: 1,408
Columns: 9
$ SOC <dbl> 1.900, 2.644, 0.800, 0.736, 15.641, 8.818, 3.782, 6.641, 4.803, …
$ DEM <dbl> 2825.1111, 2535.1086, 1716.3300, 1649.8933, 2675.3113, 2581.4839…
$ Slope <dbl> 18.981682, 14.182393, 1.585145, 9.399726, 12.569353, 6.358553, 1…
$ TPI <dbl> -0.91606224, -0.15259802, -0.39078590, -2.54008722, 7.40076303, …
$ MAT <dbl> 4.709227, 4.648000, 6.360833, 10.265385, 2.798550, 6.358550, 7.0…
$ MAP <dbl> 613.6979, 597.7912, 201.5091, 298.2608, 827.4680, 679.1392, 508.…
$ NDVI <dbl> 0.6845260, 0.7557631, 0.2215059, 0.2785148, 0.7337426, 0.7017139…
$ NLCD <chr> "Forest", "Forest", "Shrubland", "Shrubland", "Forest", "Forest"…
$ FRG <chr> "Fire Regime Group IV", "Fire Regime Group IV", "Fire Regime Gro…df$NLCD <- as.factor(df$NLCD)
df$FRG <- as.factor(df$FRG)set.seed(1245) # for reproducibility
split_01 <- initial_split(df, prop = 0.8, strata = SOC)
train <- split_01 %>% training()
test <- split_01 %>% testing()train[-c(1, 8,9)] = scale(train[-c(1,8,9)])
test[-c(1, 8,9)] = scale(test[-c(1,8,9)])library(h2o)
h2o.init(nthreads = -1, max_mem_size = "148g", enable_assertions = FALSE)
H2O is not running yet, starting it now...

Note:  In case of errors look at the following log files:
    C:\Users\zahmed2\AppData\Local\Temp\1\Rtmp2JEsAa\file713828706819/h2o_zahmed2_started_from_r.out
    C:\Users\zahmed2\AppData\Local\Temp\1\Rtmp2JEsAa\file7138c0e7b4f/h2o_zahmed2_started_from_r.err


Starting H2O JVM and connecting:  Connection successful!

R is connected to the H2O cluster:
    H2O cluster uptime:         3 seconds 265 milliseconds
    H2O cluster timezone:       America/New_York
    H2O data parsing timezone:  UTC
    H2O cluster version:        3.40.0.4
    H2O cluster version age:    3 months and 23 days
    H2O cluster name:           H2O_started_from_R_zahmed2_yqz807
    H2O cluster total nodes:    1
    H2O cluster total memory:   148.00 GB
    H2O cluster total cores:    40
    H2O cluster allowed cores:  40
    H2O cluster healthy:        TRUE
    H2O Connection ip:          localhost
    H2O Connection port:        54321
    H2O Connection proxy:       NA
    H2O Internal Security:      FALSE
R Version: R version 4.3.1 (2023-06-16 ucrt) #disable progress bar for RMarkdown
h2o.no_progress()
# Optional: remove anything from previous session
h2o.removeAll() h_df=as.h2o(df)
h_train = as.h2o(train)
h_test = as.h2o(test)train.xy<- as.data.frame(h_train)
test.xy<- as.data.frame(h_test)y <- "SOC"
x <- setdiff(names(h_df), y)# GLM Hyperprameter
glm_hyper_params <-list(
alpha = c(0,0.25,0.5,0.75,1),
lambda = c(1, 0.5, 0.1, 0.01, 0.001, 0.0001, 0.00001, 0))
# GLM Hyperprameter Grid Search
GLM_grid <- h2o.grid(
algorithm="glm",
grid_id = "glm_grid_IDs",
x= x,
y = y,
training_frame = h_train,
#validation_frame = h_valid,
standardize = TRUE,
nfolds=5,
keep_cross_validation_predictions = TRUE,
hyper_params = glm_hyper_params,
seed = 42)
# Get GLM Grid parameters
glm_get_grid <- h2o.getGrid("glm_grid_IDs",sort_by="RMSE",decreasing=FALSE)
glm_get_grid@summary_table[1,]Hyper-Parameter Search Summary: ordered by increasing RMSE
alpha lambda model_ids rmse
1 1.0 0.01 glm_grid_IDs_model_20 3.91359# Number of GLM models
length(GLM_grid@model_ids)[1] 40# The Best GLM Model
best_GLM <- h2o.getModel(glm_get_grid@model_ids[[1]])
summary(best_GLM)Model Details:
==============
H2ORegressionModel: glm
Model Key: glm_grid_IDs_model_20
GLM Model: summary
family link regularization number_of_predictors_total
1 gaussian identity Lasso (lambda = 0.01 ) 16
number_of_active_predictors number_of_iterations training_frame
1 11 1 train_sid_b870_3
H2ORegressionMetrics: glm
** Reported on training data. **
MSE: 14.92919
RMSE: 3.863831
MAE: 2.751655
RMSLE: 0.5254711
Mean Residual Deviance : 14.92919
R^2 : 0.4139503
Null Deviance :28684.03
Null D.o.F. :1125
Residual Deviance :16810.27
Residual D.o.F. :1114
AIC :6265.386
H2ORegressionMetrics: glm
** Reported on cross-validation data. **
** 5-fold cross-validation on training data (Metrics computed for combined holdout predictions) **
MSE: 15.31615
RMSE: 3.913585
MAE: 2.788419
RMSLE: 0.5316645
Mean Residual Deviance : 15.31615
R^2 : 0.3987602
Null Deviance :28740.54
Null D.o.F. :1125
Residual Deviance :17245.98
Residual D.o.F. :1113
AIC :6296.2
Cross-Validation Metrics Summary:
mean sd cv_1_valid cv_2_valid
mae 2.789308 0.255133 2.855067 2.636146
mean_residual_deviance 15.329986 2.983605 14.603878 13.805466
mse 15.329986 2.983605 14.603878 13.805466
null_deviance 5748.108400 943.440400 4927.803000 5173.992700
r2 0.397071 0.055506 0.327227 0.396031
residual_deviance 3449.196500 653.329160 3315.080300 3078.619000
rmse 3.900369 0.382600 3.821502 3.715571
rmsle 0.530569 0.042326 0.537976 0.560555
cv_3_valid cv_4_valid cv_5_valid
mae 3.119908 2.451240 2.884181
mean_residual_deviance 19.004612 11.598099 17.637875
mse 19.004612 11.598099 17.637875
null_deviance 6981.654000 5113.271500 6543.821000
r2 0.384452 0.482404 0.395243
residual_deviance 4257.033000 2644.366500 3950.883800
rmse 4.359428 3.405598 4.199747
rmsle 0.562172 0.458434 0.533705
Scoring History:
timestamp duration iterations negative_log_likelihood objective
1 2023-08-20 23:34:47 0.000 sec 0 28684.03369 25.47428
2 2023-08-20 23:34:47 0.004 sec 1 NA NA
training_rmse training_deviance training_mae training_r2
1 NA NA NA NA
2 3.86383 14.92919 2.75165 0.41395
Variable Importances: (Extract with `h2o.varimp`)
=================================================
Variable Importances:
variable relative_importance scaled_importance percentage
1 NDVI 1.562609 1.000000 0.209677
2 FRG.Fire Regime Group II 1.028139 0.657963 0.137960
3 NLCD.Forest 0.971411 0.621660 0.130348
4 NLCD.Planted/Cultivated 0.949343 0.607537 0.127386
5 MAP 0.853194 0.546006 0.114485
6 MAT 0.844094 0.540182 0.113264
7 Slope 0.600312 0.384173 0.080552
8 NLCD.Shrubland 0.296651 0.189843 0.039806
9 NLCD.Herbaceous 0.166346 0.106454 0.022321
10 FRG.Fire Regime Group III 0.101744 0.065111 0.013652
11 TPI 0.078622 0.050315 0.010550
12 FRG.Fire Regime Group I 0.000000 0.000000 0.000000
13 FRG.Fire Regime Group IV 0.000000 0.000000 0.000000
14 FRG.Fire Regime Group V 0.000000 0.000000 0.000000
15 FRG.Indeterminate FRG 0.000000 0.000000 0.000000
16 DEM 0.000000 0.000000 0.000000# RF Hyper-parameters
RF_hyper_params <-list(
ntrees = seq(100, 5000, by = 100),
max_depth=c(10,20,30,40,50),
sample_rate=c(0.7, 0.8, 0.9, 1.0)
)
# RF Hyper-parameters Search Criteria
RF_search_criteria <- list(strategy = "RandomDiscrete",
max_models = 100,
max_runtime_secs = 100,
stopping_tolerance = 0.001,
stopping_rounds = 2,
seed = 42)
# RF Grid Search
RF_grid <- h2o.grid(
algorithm="randomForest",
grid_id = "RF_grid_IDs",
x = x,
y = y,
training_frame = h_train,
#validation_frame = h_valid,
stopping_metric = "RMSE",
#fold_assignment ="Stratified",
nfolds=5,
keep_cross_validation_predictions = TRUE,
keep_cross_validation_models = TRUE,
hyper_params = RF_hyper_params,
search_criteria = RF_search_criteria,
seed = 42)
# Number RF models
length(RF_grid@model_ids)[1] 7# Get RF Grid parameters
RF_get_grid <- h2o.getGrid("RF_grid_IDs",
sort_by="RMSE",
decreasing=F)
# The Best RF model
best_RF <- h2o.getModel(RF_get_grid@model_ids[[1]])
best_RFModel Details:
==============
H2ORegressionModel: drf
Model ID: RF_grid_IDs_model_2
Model Summary:
number_of_trees number_of_internal_trees model_size_in_bytes min_depth
1 2100 2100 13756767 16
max_depth mean_depth min_leaves max_leaves mean_leaves
1 30 21.16286 441 591 516.70480
H2ORegressionMetrics: drf
** Reported on training data. **
** Metrics reported on Out-Of-Bag training samples **
MSE: NaN
RMSE: NaN
MAE: NaN
RMSLE: NaN
Mean Residual Deviance : NaN
H2ORegressionMetrics: drf
** Reported on cross-validation data. **
** 5-fold cross-validation on training data (Metrics computed for combined holdout predictions) **
MSE: 4.063384
RMSE: 2.015784
MAE: 0.9247277
RMSLE: 0.2989588
Mean Residual Deviance : 4.063384
Cross-Validation Metrics Summary:
mean sd cv_1_valid cv_2_valid cv_3_valid
mae 0.925409 0.160542 0.836177 0.826206 1.041391
mean_residual_deviance 4.067620 1.786939 3.037465 2.480472 4.638084
mse 4.067620 1.786939 3.037465 2.480472 4.638084
r2 0.843719 0.048301 0.860070 0.891483 0.849775
residual_deviance 4.067620 1.786939 3.037465 2.480472 4.638084
rmse 1.981429 0.420654 1.742833 1.574952 2.153621
rmsle 0.297981 0.029600 0.288414 0.316307 0.303233
cv_4_valid cv_5_valid
mae 0.775605 1.147668
mean_residual_deviance 3.250911 6.931169
mse 3.250911 6.931169
r2 0.854920 0.762348
residual_deviance 3.250911 6.931169
rmse 1.803028 2.632711
rmsle 0.252560 0.329392# GBM Hyper-parameters
GBM_hyper_params = list( ntrees = c(100,500, 1000, 5000),
max_depth = c(2,5,8),
min_rows = c(8,10, 12),
learn_rate = c(0.001,0.05,0.06),
sample_rate = c(0.4,0.5,0.6, 0.7),
col_sample_rate = c(0.4,0.5,0.6),
col_sample_rate_per_tree = c(0.4,0.5,0.6))
# GBM Hyper-parameters Search Criteria
GBM_search_criteria <- list(strategy = "RandomDiscrete",
max_models = 20,
max_runtime_secs = 100,
stopping_tolerance = 0.001,
stopping_rounds = 2,
seed = 42)
# GBM Hyper-parameters Grid Search
GBM_grid <- h2o.grid(
algorithm="gbm",
grid_id = "GBM_grid_ID",
x= x,
y = y,
training_frame = h_train,
#validation_frame = h_valid,
distribution ="AUTO",
stopping_metric = "RMSE",
#fold_assignment ="Stratified",
nfolds=5,
keep_cross_validation_predictions = TRUE,
keep_cross_validation_models = TRUE,
hyper_params = GBM_hyper_params,
search_criteria = GBM_search_criteria,
seed = 42)
# Number GBM models
length(GBM_grid@model_ids)[1] 9# Get GBM Grid parameters
GBM_get_grid <- h2o.getGrid("GBM_grid_ID",
sort_by="RMSE",
decreasing=F)
# the Best GBM Model
best_GBM <- h2o.getModel(GBM_get_grid@model_ids[[1]])
best_GBMModel Details:
==============
H2ORegressionModel: gbm
Model ID: GBM_grid_ID_model_6
Model Summary:
number_of_trees number_of_internal_trees model_size_in_bytes min_depth
1 5000 5000 1201737 5
max_depth mean_depth min_leaves max_leaves mean_leaves
1 5 4.88200 1 28 14.34820
H2ORegressionMetrics: gbm
** Reported on training data. **
MSE: 0.0230585
RMSE: 0.1518503
MAE: 0.08245979
RMSLE: 0.03455086
Mean Residual Deviance : 0.0230585
H2ORegressionMetrics: gbm
** Reported on cross-validation data. **
** 5-fold cross-validation on training data (Metrics computed for combined holdout predictions) **
MSE: 3.864736
RMSE: 1.965893
MAE: 0.9206979
RMSLE: 0.3080422
Mean Residual Deviance : 3.864736
Cross-Validation Metrics Summary:
mean sd cv_1_valid cv_2_valid cv_3_valid
mae 0.921399 0.154959 0.795396 0.886219 0.937009
mean_residual_deviance 3.870569 1.627937 2.616240 3.275838 3.752155
mse 3.870569 1.627937 2.616240 3.275838 3.752155
r2 0.850103 0.045401 0.879475 0.856687 0.878470
residual_deviance 3.870569 1.627937 2.616240 3.275838 3.752155
rmse 1.937714 0.380513 1.617479 1.809928 1.937048
rmsle 0.307537 0.020689 0.321700 0.313348 0.288148
cv_4_valid cv_5_valid
mae 0.809666 1.178706
mean_residual_deviance 3.020706 6.687905
mse 3.020706 6.687905
r2 0.865193 0.770689
residual_deviance 3.020706 6.687905
rmse 1.738018 2.586098
rmsle 0.283774 0.330713# DNN Hyper-parameters
DNN_hyper_params <- list(
activation = c("Rectifier",
"Maxout",
"Tanh",
"RectifierWithDropout",
"MaxoutWithDropout",
"TanhWithDropout"),
hidden = list( c(50, 50, 50, 50),
c(100, 100, 100), c(200, 200, 200)),
epochs = c(50, 100, 200, 500),
l1 = c(0, 0.00001, 0.0001),
l2 = c(0, 0.00001, 0.0001),
rate = c(0, 01, 0.005, 0.001),
rate_decay = c(0.5, 1.0, 1.5),
rate_annealing = c(1e-5, 1e-6, 1e-5),
rho = c(0.9, 0.95, 0.99, 0.999),
epsilon = c(1e-06, 1e-08, 1e-09),
momentum_start = c(0, 0.5),
momentum_stable = c(0.99, 0.5, 0),
regression_stop = c(1e-05, 1e-06,1e-07),
input_dropout_ratio = c(0, 0.0001, 0.001),
max_w2 = c(10, 100, 1000, 3.4028235e+38)
)
# DNN Hyper-parameters Search criteria
DNN_search_criteria <- list(strategy = "RandomDiscrete",
max_models = 100,
max_runtime_secs = 100,
stopping_tolerance = 0.001,
stopping_rounds = 3,
seed = 1345767)
# DNN Hyper-parameters Grid Search
DNN_grid <- h2o.grid(
algorithm="deeplearning",
grid_id = "DNN_grid_IDs",
x= x,
y = y,
standardize = TRUE,
shuffle_training_data = TRUE,
training_frame = h_train,
#validation_frame = h_valid,
distribution ="AUTO",
stopping_metric = "RMSE",
nfolds= 5,
keep_cross_validation_predictions = TRUE,
keep_cross_validation_models = TRUE,
hyper_params = DNN_hyper_params,
search_criteria = DNN_search_criteria,
seed = 42)
# Number DNN models
length(DNN_grid@model_ids)[1] 8# Get DNN Grid parameters
DNN_get_grid <- h2o.getGrid("DNN_grid_IDs",
sort_by="RMSE",
decreasing=F)
#The Best DNN model
best_DNN <- h2o.getModel(DNN_get_grid@model_ids[[1]])
best_DNNModel Details:
==============
H2ORegressionModel: deeplearning
Model ID: DNN_grid_IDs_model_5
Status of Neuron Layers: predicting SOC, regression, gaussian distribution, Quadratic loss, 22,201 weights/biases, 268.4 KB, 168,900 training samples, mini-batch size 1
layer units type dropout l1 l2 mean_rate rate_rms momentum
1 1 18 Input 0.01 % NA NA NA NA NA
2 2 100 Tanh 0.00 % 0.000000 0.000010 0.123531 0.311861 0.000000
3 3 100 Tanh 0.00 % 0.000000 0.000010 0.092727 0.037251 0.000000
4 4 100 Tanh 0.00 % 0.000000 0.000010 0.290924 0.235394 0.000000
5 5 1 Linear NA 0.000000 0.000010 0.004809 0.002813 0.000000
mean_weight weight_rms mean_bias bias_rms
1 NA NA NA NA
2 -0.003053 0.219074 -0.012153 0.117641
3 0.000674 0.210016 -0.056392 0.400292
4 0.001608 0.189505 0.011670 0.200583
5 -0.019575 0.156305 0.393800 0.000000
H2ORegressionMetrics: deeplearning
** Reported on training data. **
** Metrics reported on full training frame **
MSE: 0.5887356
RMSE: 0.7672911
MAE: 0.479878
RMSLE: 0.1532572
Mean Residual Deviance : 0.5887356
H2ORegressionMetrics: deeplearning
** Reported on cross-validation data. **
** 5-fold cross-validation on training data (Metrics computed for combined holdout predictions) **
MSE: 8.533812
RMSE: 2.921269
MAE: 1.854599
RMSLE: 0.4750774
Mean Residual Deviance : 8.533812
Cross-Validation Metrics Summary:
mean sd cv_1_valid cv_2_valid cv_3_valid
mae 1.882443 0.178120 2.053711 1.609837 1.902987
mean_residual_deviance 8.749826 1.923908 9.983020 5.719348 8.222628
mse 8.749826 1.923908 9.983020 5.719348 8.222628
r2 0.649819 0.090486 0.540101 0.749787 0.733674
residual_deviance 8.749826 1.923908 9.983020 5.719348 8.222628
rmse 2.942161 0.341893 3.159592 2.391516 2.867513
rmsle 0.480092 0.043872 NA 0.502384 0.416028
cv_4_valid cv_5_valid
mae 1.823907 2.021770
mean_residual_deviance 9.163216 10.660922
mse 9.163216 10.660922
r2 0.591067 0.634465
residual_deviance 9.163216 10.660922
rmse 3.027080 3.265107
rmsle 0.513239 0.488718# rf-parameters
rf_params <- list(
ntrees = 2000,
max_depth =25,
sample_rate = 0.8,
stopping_tolerance = 0.001,
stopping_rounds = 3,
stopping_metric = "RMSE")
stack_best <-h2o.stackedEnsemble(
model_id = "stack_RF_ID",
x= x,
y = y,
training_frame = h_train,
#validation_frame = h_valid,
base_models = list(best_GLM,
best_RF,
best_GBM,
best_DNN
),
metalearner_algorithm = "drf",
metalearner_params = rf_params,
metalearner_nfolds = 5,
seed = 42
)
stack_beststack.test.best<-as.data.frame(h2o.predict(object = stack_best, newdata = h_test))
test.xy$Stack_SOC_best<-stack.test.best$predictRMSE.best<- Metrics::rmse(test.xy$SOC, test.xy$Stack_SOC_best)
MAE.best<- Metrics::mae(test.xy$SOC, test.xy$Stack_SOC_best)
# Print results
paste0("RMSE: ", round(RMSE.best,2))[1] "RMSE: 2.96"paste0("MAE: ", round(MAE.best,2))[1] "MAE: 2.13"library(ggpmisc)
formula<-y~x
ggplot(test.xy, aes(SOC,Stack_SOC_best)) +
geom_point() +
geom_smooth(method = "lm")+
stat_poly_eq(use_label(c("eq", "adj.R2")), formula = formula) +
ggtitle("Stack-Ensemble: The Best of Family") +
xlab("Observed") + ylab("Predicted") +
scale_x_continuous(limits=c(0,25), breaks=seq(0, 25, 5))+
scale_y_continuous(limits=c(0,25), breaks=seq(0, 25, 5)) +
# Flip the bars
theme(
panel.background = element_rect(fill = "grey95",colour = "gray75",size = 0.5, linetype = "solid"),
axis.line = element_line(colour = "grey"),
plot.title = element_text(size = 14, hjust = 0.5),
axis.title.x = element_text(size = 14),
axis.title.y = element_text(size = 14),
axis.text.x=element_text(size=13, colour="black"),
axis.text.y=element_text(size=13,angle = 90,vjust = 0.5, hjust=0.5, colour='black'))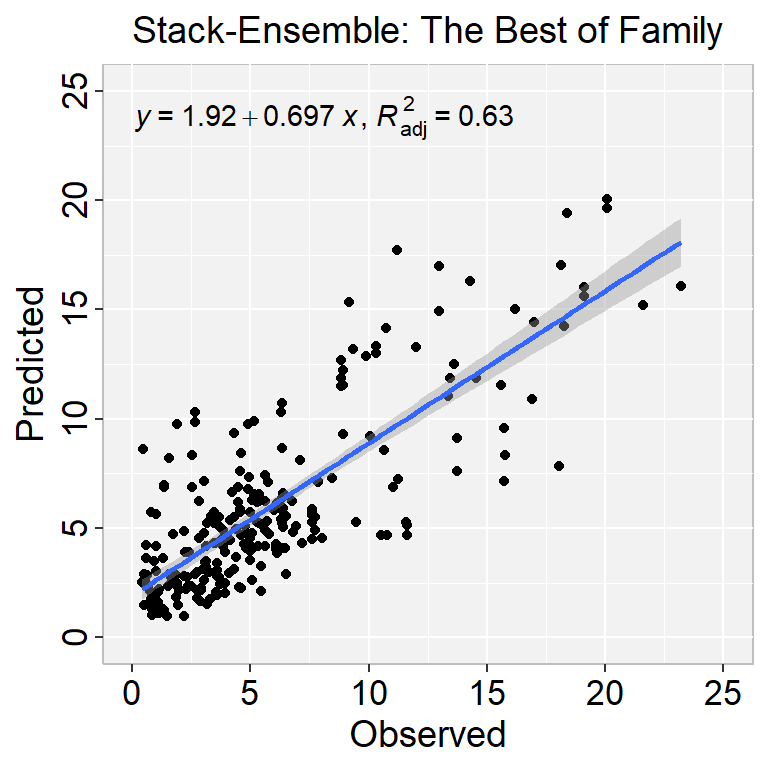
all_01 = append(GLM_grid@model_ids, RF_grid@model_ids)
all_02<-append(all_01,DNN_grid@model_ids)
all_03<-append(all_02,GBM_grid@model_ids)
length(all_03)
[1] 64stack_all<- h2o.stackedEnsemble(
model_id = "stack_Model_ALL_IDs",
x= x,
y = y,
training_frame = h_train,
base_models = all_03,
metalearner_algorithm = "drf",
metalearner_nfolds = 5,
metalearner_params = rf_params,
keep_levelone_frame = TRUE,
seed=123)
stack_allModel Details:
==============
H2ORegressionModel: stackedensemble
Model ID: stack_Model_ALL_IDs
Model Summary for Stacked Ensemble:
key
1 Stacking strategy
2 Number of base models (used / total)
3 # GBM base models (used / total)
4 # GLM base models (used / total)
5 # DRF base models (used / total)
6 # DeepLearning base models (used / total)
7 Metalearner algorithm
8 Metalearner fold assignment scheme
9 Metalearner nfolds
10 Metalearner fold_column
11 Custom metalearner hyperparameters
value
1 cross_validation
2 64/64
3 9/9
4 40/40
5 7/7
6 8/8
7 DRF
8 Random
9 5
10 NA
11 {\n "ntrees": [2000],\n "max_depth": [25],\n "sample_rate": [0.8],\n "stopping_tolerance": [0.001],\n "stopping_rounds": [3],\n "stopping_metric": ["RMSE"]\n}
H2ORegressionMetrics: stackedensemble
** Reported on training data. **
MSE: 0.2737613
RMSE: 0.523222
MAE: 0.3143622
RMSLE: 0.07102723
Mean Residual Deviance : 0.2737613
H2ORegressionMetrics: stackedensemble
** Reported on cross-validation data. **
** 5-fold cross-validation on training data (Metrics computed for combined holdout predictions) **
MSE: 3.588121
RMSE: 1.894234
MAE: 0.9595951
RMSLE: 0.2882307
Mean Residual Deviance : 3.588121
Cross-Validation Metrics Summary:
mean sd cv_1_valid cv_2_valid cv_3_valid
mae 0.960719 0.099602 0.931848 0.835287 0.914153
mean_residual_deviance 3.647374 1.155167 2.811425 3.013221 2.834578
mse 3.647374 1.155167 2.811425 3.013221 2.834578
r2 0.854546 0.051894 0.878888 0.890242 0.899937
residual_deviance 3.647374 1.155167 2.811425 3.013221 2.834578
rmse 1.892248 0.288902 1.676730 1.735863 1.683620
rmsle 0.288314 0.024586 0.294013 0.300423 0.245133
cv_4_valid cv_5_valid
mae 1.080815 1.041493
mean_residual_deviance 4.092324 5.485324
mse 4.092324 5.485324
r2 0.827205 0.776459
residual_deviance 4.092324 5.485324
rmse 2.022950 2.342077
rmsle 0.295891 0.306112stack.test.all<-as.data.frame(h2o.predict(object = stack_all, newdata = h_test))
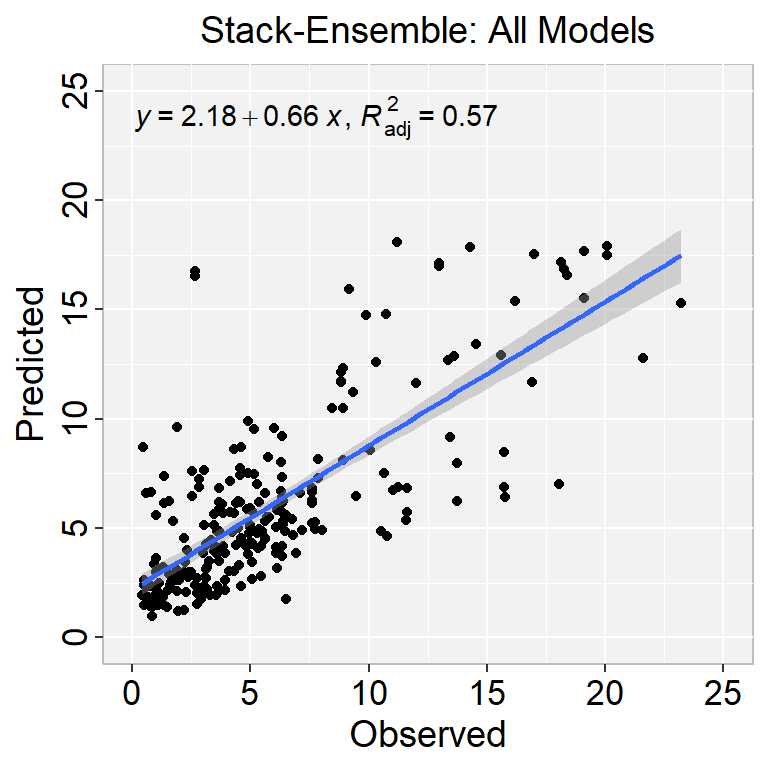
test.xy$Stack_SOC_all<-stack.test.all$predictRMSE.all<- Metrics::rmse(test.xy$SOC, test.xy$Stack_SOC_all)
MAE.all<- Metrics::mae(test.xy$SOC, test.xy$Stack_SOC_all)
# Print results
paste0("RMSE: ", round(RMSE.all,2))[1] "RMSE: 3.27"paste0("MAE: ", round(MAE.all,2))[1] "MAE: 2.23"library(ggpmisc)
formula<-y~x
ggplot(test.xy, aes(SOC,Stack_SOC_all)) +
geom_point() +
geom_smooth(method = "lm")+
stat_poly_eq(use_label(c("eq", "adj.R2")), formula = formula) +
ggtitle("Stack-Ensemble: All Models") +
xlab("Observed") + ylab("Predicted") +
scale_x_continuous(limits=c(0,25), breaks=seq(0, 25, 5))+
scale_y_continuous(limits=c(0,25), breaks=seq(0, 25, 5)) +
# Flip the bars
theme(
panel.background = element_rect(fill = "grey95",colour = "gray75",size = 0.5, linetype = "solid"),
axis.line = element_line(colour = "grey"),
plot.title = element_text(size = 14, hjust = 0.5),
axis.title.x = element_text(size = 14),
axis.title.y = element_text(size = 14),
axis.text.x=element_text(size=13, colour="black"),
axis.text.y=element_text(size=13,angle = 90,vjust = 0.5, hjust=0.5, colour='black'))