Code
library(tidyverse)
# define data folder
urlfile = "https://github.com//zia207/r-colab/raw/main/Data/USA/gp_soil_data.csv"
mf<-read_csv(url(urlfile))Multivariate Analysis of Variance (MANOVA) is a statistical technique used to analyze data that involve multiple dependent variables and one or more independent variables. It is an extension of the univariate analysis of variance (ANOVA), which is used to analyze data that involve a single dependent variable.
MANOVA allows researchers to determine whether there are significant differences among groups on multiple dependent variables simultaneously. This can be useful when studying complex phenomena where multiple variables may be involved in explaining the outcome of interest.
MANOVA is based on the general linear model (GLM) framework and involves estimating a set of linear equations that relate the dependent variables to the independent variables. The technique produces a set of output statistics, including F-values and p-values, that indicate whether there are significant differences among groups on the dependent variables.
In contrast to ANOVA, where we compare individual group means, MANOVA compares the vectors containing the group mean of each dependent variable. MANOVA uses omnibus Wilk’s Lambda, Pillai’s Trace (most robust to departures from assumptions), Roy’s Largest Root, or Hotelling-Lawley’s test, which are later converted to F statistics for assessing the significance of the group differences. Pillai’s Trace has the highest statistical power. MANOVA maximizes the discrimination in between-groups than within-groups based on best linear combinations of the multiple response variables.
MANOVA analyzes the differences among groups in an independent variable by considering multiple dependent variables. This reduces the type I error which can be inflated by performing separate univariate ANOVA for each dependent variable. MANOVA also controls for inter-correlations among the multiple dependent variables in the dataset. As compared to univariate ANOVA, MANOVA uses more information from the dependent variables i.e., MANOVA may find differences between groups based on combined information from the multiple dependent variables.
MANOVA follows similar assumptions as in ANOVA for the independence of observations and homogeneity of variances
Data
Suppose we have a data set of different landuse (NLCD) and with SOC and NDVI, We want to see if SOC and NDVI are associated with different NLCD using MANOVA.
library(tidyverse)
# define data folder
urlfile = "https://github.com//zia207/r-colab/raw/main/Data/USA/gp_soil_data.csv"
mf<-read_csv(url(urlfile))Get summary statistics based on each dependent variable:
# summary statistics for dependent variable height
mf %>% group_by(NLCD) %>%  summarise(n = n(), mean = mean(SOC), sd = sd(SOC))
# A tibble: 4 × 4
NLCD n mean sd
<chr> <int> <dbl> <dbl>
1 Forest 93 10.4 6.80
2 Herbaceous 150 5.48 3.93
3 Planted/Cultivated 97 6.70 3.60
4 Shrubland 127 4.13 3.74# summary statistics for dependent variable canopy_vol
mf %>% group_by(NLCD) %>% summarise(n = n(), mean = mean(NDVI), sd = sd(NDVI))# A tibble: 4 × 4
NLCD n mean sd
<chr> <int> <dbl> <dbl>
1 Forest 93 0.571 0.116
2 Herbaceous 150 0.400 0.131
3 Planted/Cultivated 97 0.533 0.121
4 Shrubland 127 0.308 0.130#| fig.width: 8
#| fig.height: 5
# SOC
p1 <- ggplot(mf, aes(x = NLCD, y = SOC, fill = NLCD)) +
geom_boxplot(outlier.shape = NA) +
theme(legend.position="none")+
ggtitle("SOC vs NLCD")
# NDVI
p2 <- ggplot(mf, aes(x = NLCD, y = NDVI, fill = NLCD)) +
geom_boxplot(outlier.shape = NA) +
theme(legend.position="none") +
ggtitle("NDVI vs NLCD") library(patchwork)
p1+p2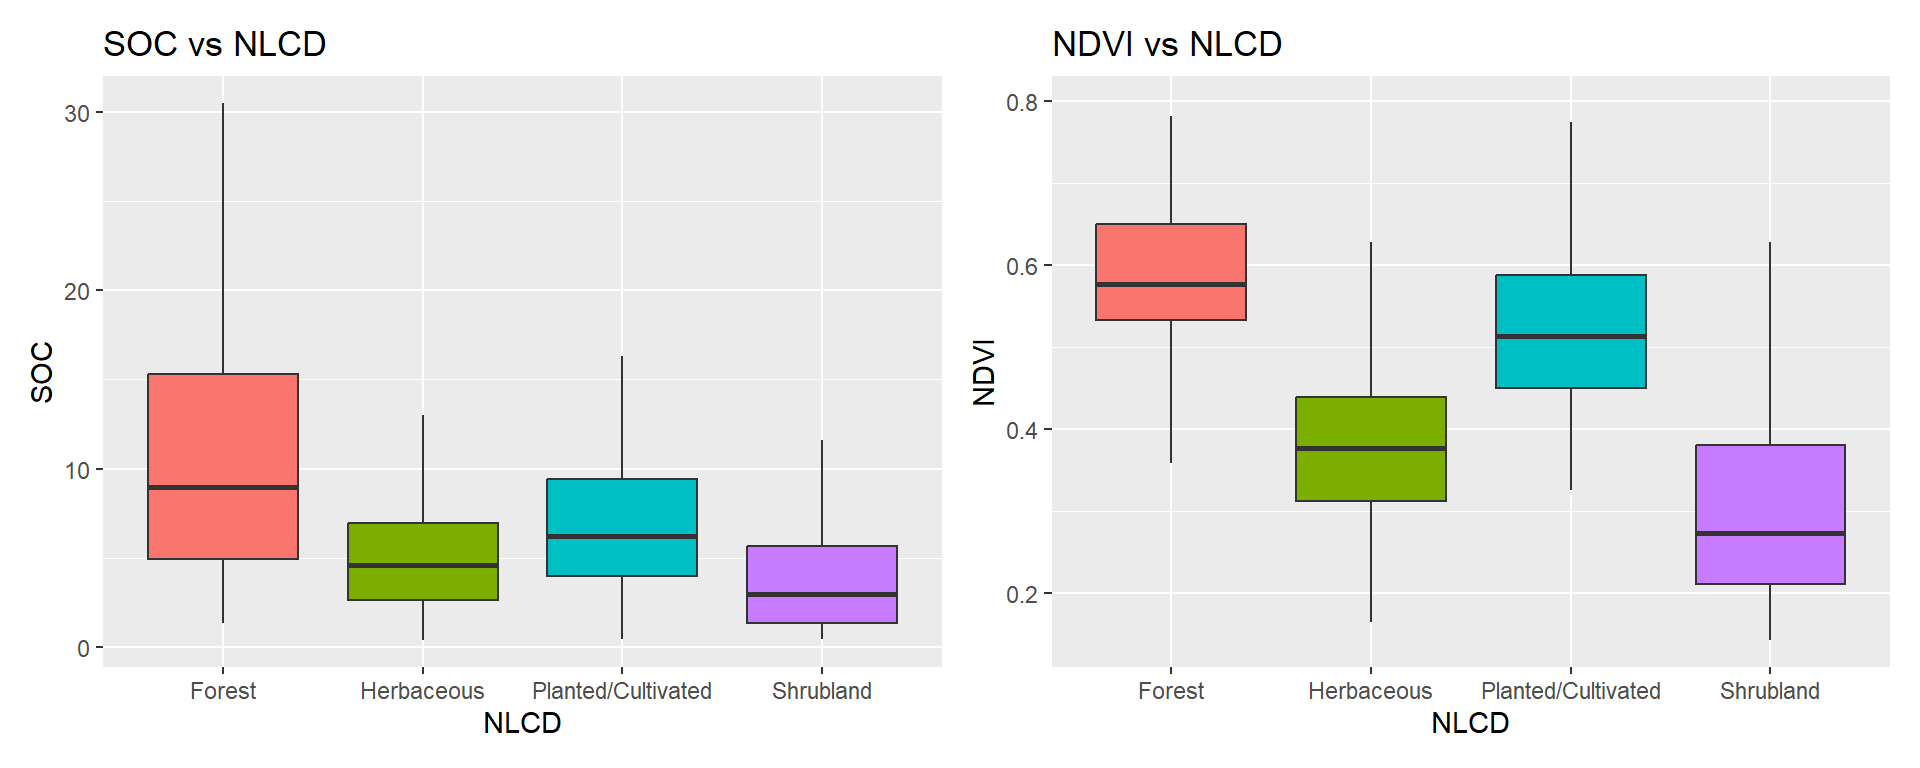
In R, the manova function is used to perform a Multivariate Analysis of Variance (MANOVA). The syntax for the manova function is as follows:
dep_vars <- cbind(mf$SOC, mf$NDVI)
fit <- manova(dep_vars ~ NLCD, data = mf)The output of manova function is useful for testing whether there are significant differences between groups on multiple dependent variables. It is also useful for investigating the direction and magnitude of the effects.
summary(fit) Df Pillai approx F num Df den Df Pr(>F)
NLCD 3 0.45615 45.599 6 926 < 2.2e-16 ***
Residuals 463
---
Signif. codes: 0 '***' 0.001 '**' 0.01 '*' 0.05 '.' 0.1 ' ' 1The Pillai’s Trace test statistics is statistically significant [Pillai’s Trace = 0.4561, F(6, 926) = 45.599, p < 0.001] and indicates that NLCD have a statistically significant association with both combined SOC and NDVI.
# get effect size
library(effectsize)
effectsize::eta_squared(fit)
# Effect Size for ANOVA (Type I)
Parameter | Eta2 (partial) | 95% CI
-----------------------------------------
NLCD | 0.23 | [0.19, 1.00]
- One-sided CIs: upper bound fixed at [1.00].The measure of effect size (Partial Eta Squared; ηp2) is 0.23 and suggests that there is a moderte effect of NLCD on both SOC and NDVI.
The MANOVA results suggest that there are statistically significant (p < 0.001) differences between NLCD, but it does not tell which NLCD are different from each other. To know which NLCD are significantly different, the post-hoc test needs to carry out.
To test the between-group differences, the univariate ANOVA can be done on each dependent variable, but this will be not appropriate and lose information that can be obtained from multiple variables together.
Linear discriminant analysis (LDA) is useful to show the differences between each group. LDA will discriminate the groups using information from both the dependent variables
Discriminant analysis is a statistical method used to determine whether a set of variables can be used to classify observations into predefined groups. The goal of discriminant analysis is to build a predictive model that uses a set of predictor variables to classify new observations into one of several predefined groups. This can be used to understand the differences between groups, to identify the most important variables in predicting group membership, and to develop a classification rule that can be used to classify new observations.
There are two types of discriminant analysis: linear discriminant analysis (LDA) and quadratic discriminant analysis (QDA)
Discriminant analysis is commonly used for classification problems in which the classes are well-defined and the data are normally distributed. It can be used for both binary classification (i.e., separating two groups) and multi-class classification (i.e., separating more than two groups). It can also be used for feature selection, to identify the most important variables in predicting group membership.
lda() function of MASS package to do Linear Discriminant Analysis of group variables:
library(MASS)
post_hoc <- lda(mf$NLCD ~ dep_vars, CV=F)
post_hoc
Call:
lda(mf$NLCD ~ dep_vars, CV = F)
Prior probabilities of groups:
Forest Herbaceous Planted/Cultivated Shrubland
0.1991435 0.3211991 0.2077088 0.2719486
Group means:
dep_vars1 dep_vars2
Forest 10.430882 0.5705648
Herbaceous 5.476967 0.4003461
Planted/Cultivated 6.696722 0.5332255
Shrubland 4.130764 0.3083878
Coefficients of linear discriminants:
LD1 LD2
dep_vars1 -0.01809082 -0.250882
dep_vars2 -7.60110166 4.955480
Proportion of trace:
LD1 LD2
0.9167 0.0833 We can plot LD1 and LD2 to visualize discrimination of two predicted lda values:
# create dataframe
plot_lda <- data.frame(mf[, "NLCD"], lda = predict(post_hoc)$x)
# plot
ggplot(plot_lda) +
    geom_point(aes(x = lda.LD1, y = lda.LD2, colour =NLCD), size = 4)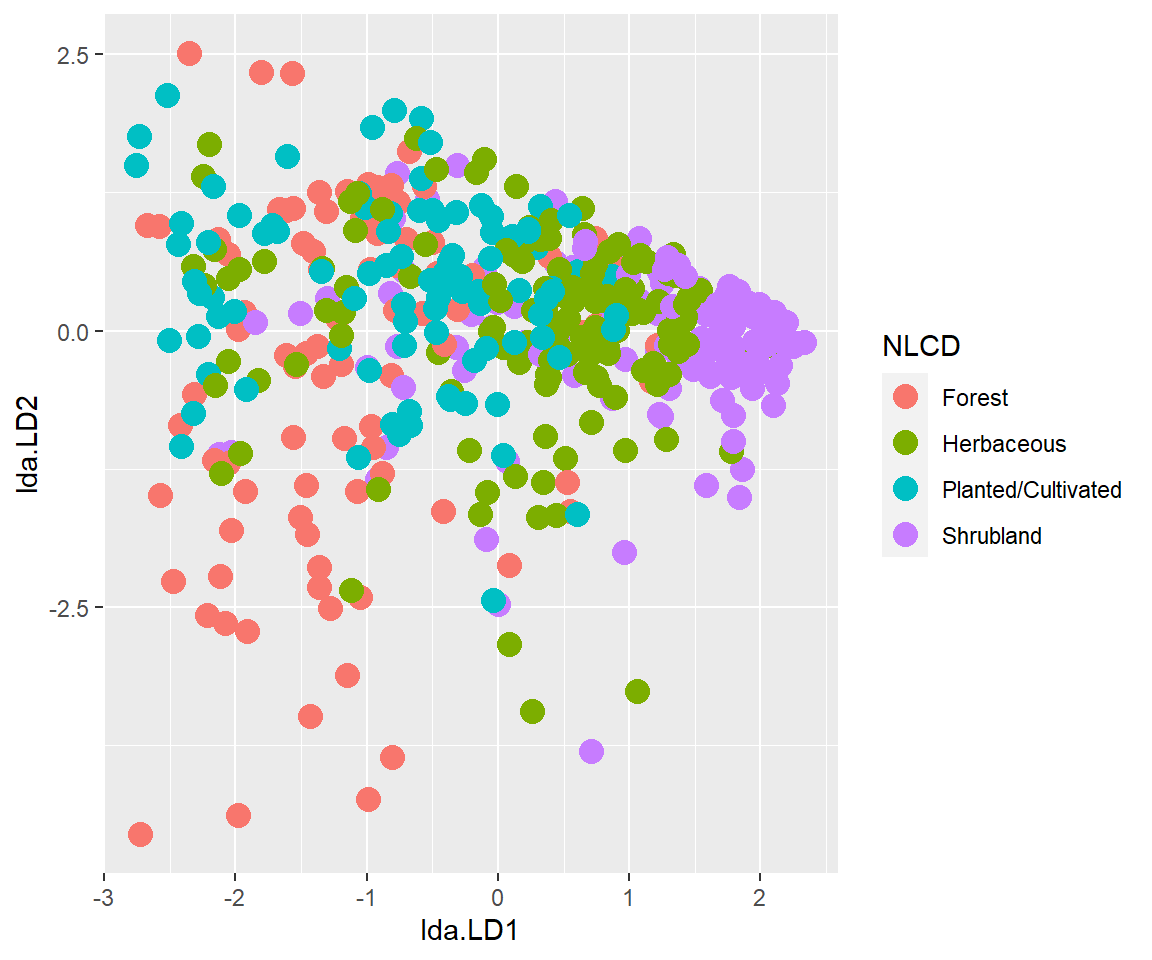
The LDA scatter plot discriminates against NLCDs based on the two dependent variables. The Forest and Shurbland has a significant difference (well separated) as compared to Herbaceous and Planted/Cultivated land.