![]()

Non-Linear Models
Non-linear regression is a form of regression analysis in which observational data are modeled by a function which is a non-linear combination of the model parameters and depends on one or more independent variables. Essentially, it is used to model complex relationships between variables that cannot be captured by a straight line. Non-linear regression models are widely used in various fields such as biology, economics, engineering, and more, where the relationships between variables are inherently non-linear. In this tutorial, we will explore the key concepts of non-linear regression, different types of non-linear models, and their applications.
- Humped Curve
- Polynomial Models
- Exponential Models
- Asymptotic Models
- S-shaped Functions or Sigmoid Models
- Self-starting Function
Intoduction to Non-Linear Models
In many real-world scenarios, relationships between variables are not strictly linear. Simple linear regression assumes a straight-line relationship, but in practice, many natural and scientific phenomena exhibit non-linear patterns. For example, exponential growth, logistic population models, and enzyme kinetics in biology all follow non-linear trends.
This tutorial introduces non-linear modeling in R, focusing on the nls() (Non-Linear Least Squares) function. By the end of this guide, you will learn how to:
- Identify non-linear relationships in data
- Fit non-linear models using nls()
- Interpret model parameters and predictions
- Visualize model fits effectively
Understanding non-linear regression is essential for accurately modeling complex data and making meaningful predictions in various domains, such as economics, biology, engineering, and environmental science.
Key Points about Non-linear Regression:
Non-linearity in Parameters: Unlike linear regression, where the model is linear in the parameters, non-linear regression models have at least one parameter appearing non-linearly.
Model Form: The model can take various forms, such as polynomial, exponential, logarithmic, power, and others. The choice of model depends on the nature of the data and the relationship between the variables.
Estimation of Parameters: The parameters of a non-linear regression model are estimated using iterative optimization techniques like the Gauss-Newton algorithm, the Levenberg-Marquardt algorithm, or other numerical methods. These methods aim to minimize the difference between the observed and predicted values (the residuals).
Applications: Non-linear regression is widely used in various fields such as biology, economics, engineering, and more, where the relationships between variables are inherently non-linear.
Complexity and Flexibility: Non-linear models can capture more complex relationships than linear models, but they also require more data and more sophisticated techniques to estimate the parameters accurately.
Example of a Non-linear Regression Model
Non-linear models come in various forms, each suited to different types of data and relationships between variables.
Here are some common types of non-linear models :
1. Humped Curves
Humped curves, also known as unimodal curves, are characterized by a single peak or “hump” and are commonly used to describe phenomena where a variable increases to a maximum point and then decreases. These types of curves are often found in various fields such as biology, economics, and environmental science.
Some common types of humped curves include:
Gaussian (Normal) Distribution: A symmetric bell-shaped curve that is widely used in statistics to represent the distribution of a set of data.
Log-Normal Distribution: A distribution of a random variable whose logarithm is normally distributed, often used in finance and environmental studies.
Beta Distribution: A family of continuous probability distributions defined on the interval [0, 1], often used to model random variables that are constrained within a fixed range.
Ricker Curve: A population growth model used in ecology to describe the growth of populations, characterized by rapid growth followed by a decline as the population approaches a carrying capacity.
First-order Compartment: A model in pharmacokinetics where the rate of change of drug concentration is proportional to the concentration of the drug.
Biexponential Humped Curves: A curve with two exponential terms that describe a rapid initial decline followed by a slower decline.

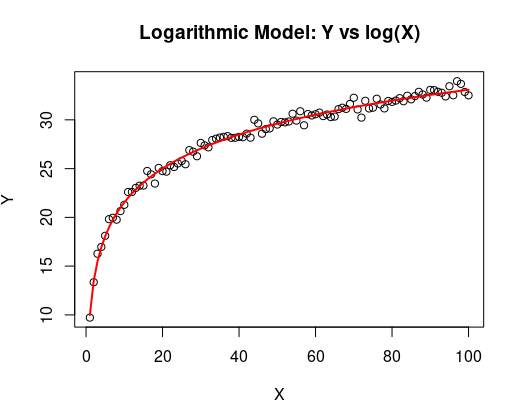
2. Logarithmic Models
Logarithmic models are used when the rate of change in the data decreases over time or space.
\[ y = a + b \cdot \ln(x) \]
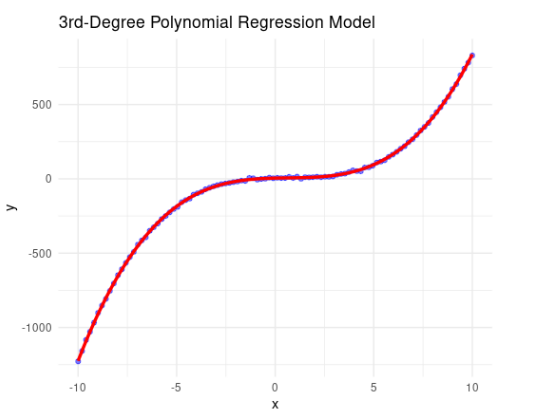
3. Polynomial Models
Polynomial models are an extension of linear models that can capture curvilinear relationships by including polynomial terms (squared, cubed, etc.) of the predictors.
\[ y = a_0 + a_1x + a_2x^2 + \cdots + a_nx^n \]
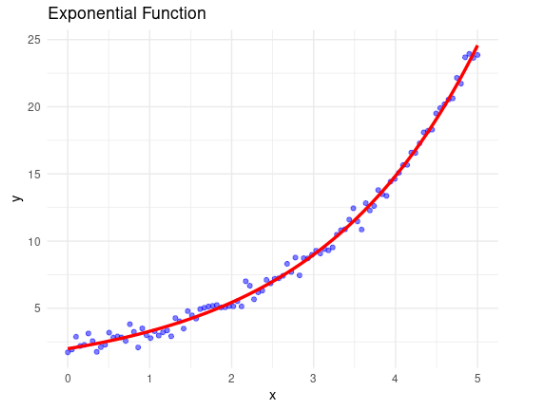
4. Exponential Models
Exponential models describe relationships where the rate of change increases or decreases exponentially.
\[ y = a \cdot e^{bx} \]
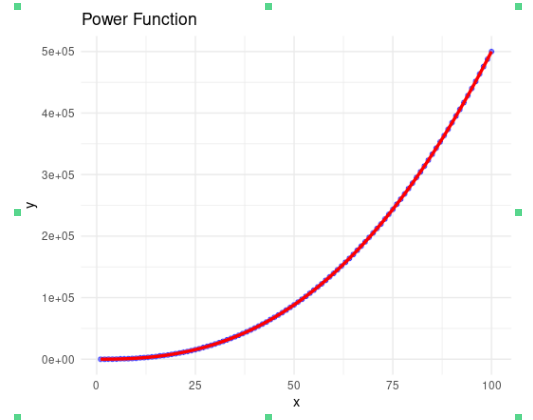
5. Power Models
Power models are used when data follows a power law, which is common in natural phenomena.
\[ y = a \cdot x^b \]
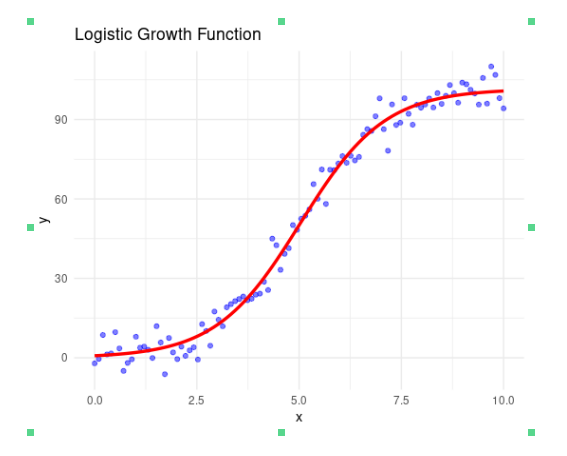
6. Logistic Models
Logistic models are used to describe growth that saturates over time, often used in population growth, adoption of technology, etc.
\[ y = \frac{L}{1 + e^{-k(x - x_0)}} \]
Where:
- \(L\) is the curve’s maximum value.
- \(k\) is the steepness of the curve.
- \(x_0\) is the x-value of the sigmoid’s midpoint.
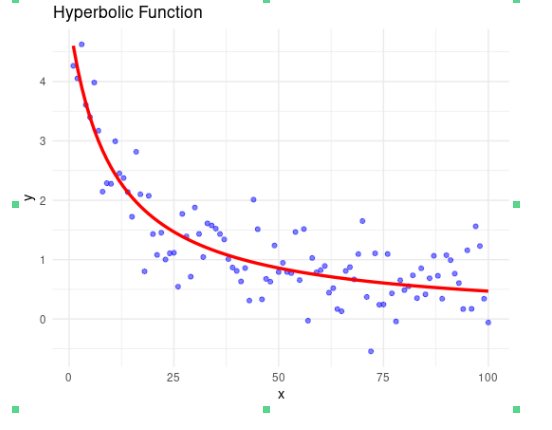
6. Hyperbolic Models
A hyperbolic model is a type of mathematical model used to describe relationships that follow a hyperbolic distribution. In its simplest form, a hyperbolic model can be represented as:
\[ y = \frac{a}{b + x} \]
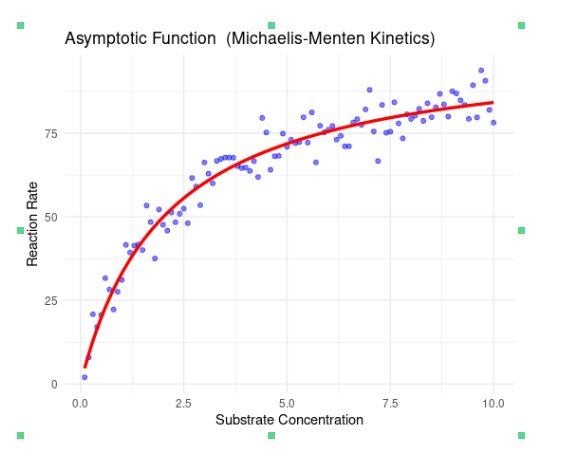
7. Asymptotic Model
An asymptotic model is a type of mathematical model used to describe relationships where the dependent variable approaches a constant value as the independent variable increases. An example of an asymptotic model is:
\[ y = a - \frac{b}{x + c} \]
Summary and Conclusions
Non-linear regression models are essential tools for modeling complex relationships between variables that cannot be captured by linear models. They offer flexibility and can capture a wide range of patterns and behaviors in the data. By using non-linear regression techniques, researchers and analysts can gain deeper insights into the underlying processes and mechanisms that govern the data. However, fitting non-linear models requires careful consideration of the model form, parameter estimation, and model evaluation to ensure the model’s validity and reliability. With the right tools and techniques, non-linear modeling can provide valuable insights and enhance our understanding of complex systems and phenomena.
References
Books on Non-Linear Modeling
- “Nonlinear Regression Analysis and Its Applications” by Douglas M. Bates and Donald G. Watts
- This book provides a comprehensive introduction to nonlinear regression analysis. It covers theory, methodology, and practical applications of nonlinear models.
- “Nonlinear Models for Repeated Measurement Data” by Marie Davidian and David M. Giltinan
- This book focuses on the analysis of repeated measurement data using nonlinear models. It discusses various methodologies and provides real-world examples.
- “Applied Nonlinear Time Series Analysis: Applications in Physics, Physiology and Finance” by Michael Small
- This book describes the application of nonlinear time series analysis techniques to various fields including physics, physiology, and finance.
- “Nonlinear Dynamics and Chaos: With Applications to Physics, Biology, Chemistry, and Engineering” by Steven H. Strogatz
- This book provides an introduction to nonlinear dynamics and chaos theory, with applications to various scientific and engineering fields.
- “Nonlinear Time Series: Theory, Methods, and Applications with R Examples” by Randal Douc, Eric Moulines, and David Stoffer
- This book offers a comprehensive treatment of nonlinear time series analysis, including theory, methods, and applications. It includes numerous examples implemented in R.
Online Resources
- Coursera: Nonlinear Dynamics and Chaos
- An online course offered by Santa Fe Institute that provides an introduction to nonlinear dynamics and chaos theory.
- Coursera: Nonlinear Dynamics and Chaos
- edX: Nonlinear Optimization
- An online course offered by The University of Texas at Austin that covers nonlinear optimization techniques and their applications.
- edX: Nonlinear Optimization
- Khan Academy: Differential Equations
- A series of lectures and exercises on differential equations, including topics on nonlinear differential equations.
- Khan Academy: Differential Equations
- R Documentation: nls Function
- Official documentation for the
nlsfunction in R, which is used for nonlinear least squares modeling. - R Documentation: nls Function
- Official documentation for the
- Stack Overflow: Nonlinear Regression Questions
- A community-driven Q&A platform where users can ask and answer questions related to nonlinear regression and modeling.
- Stack Overflow: Nonlinear Regression Questions